End of Summer Market Report
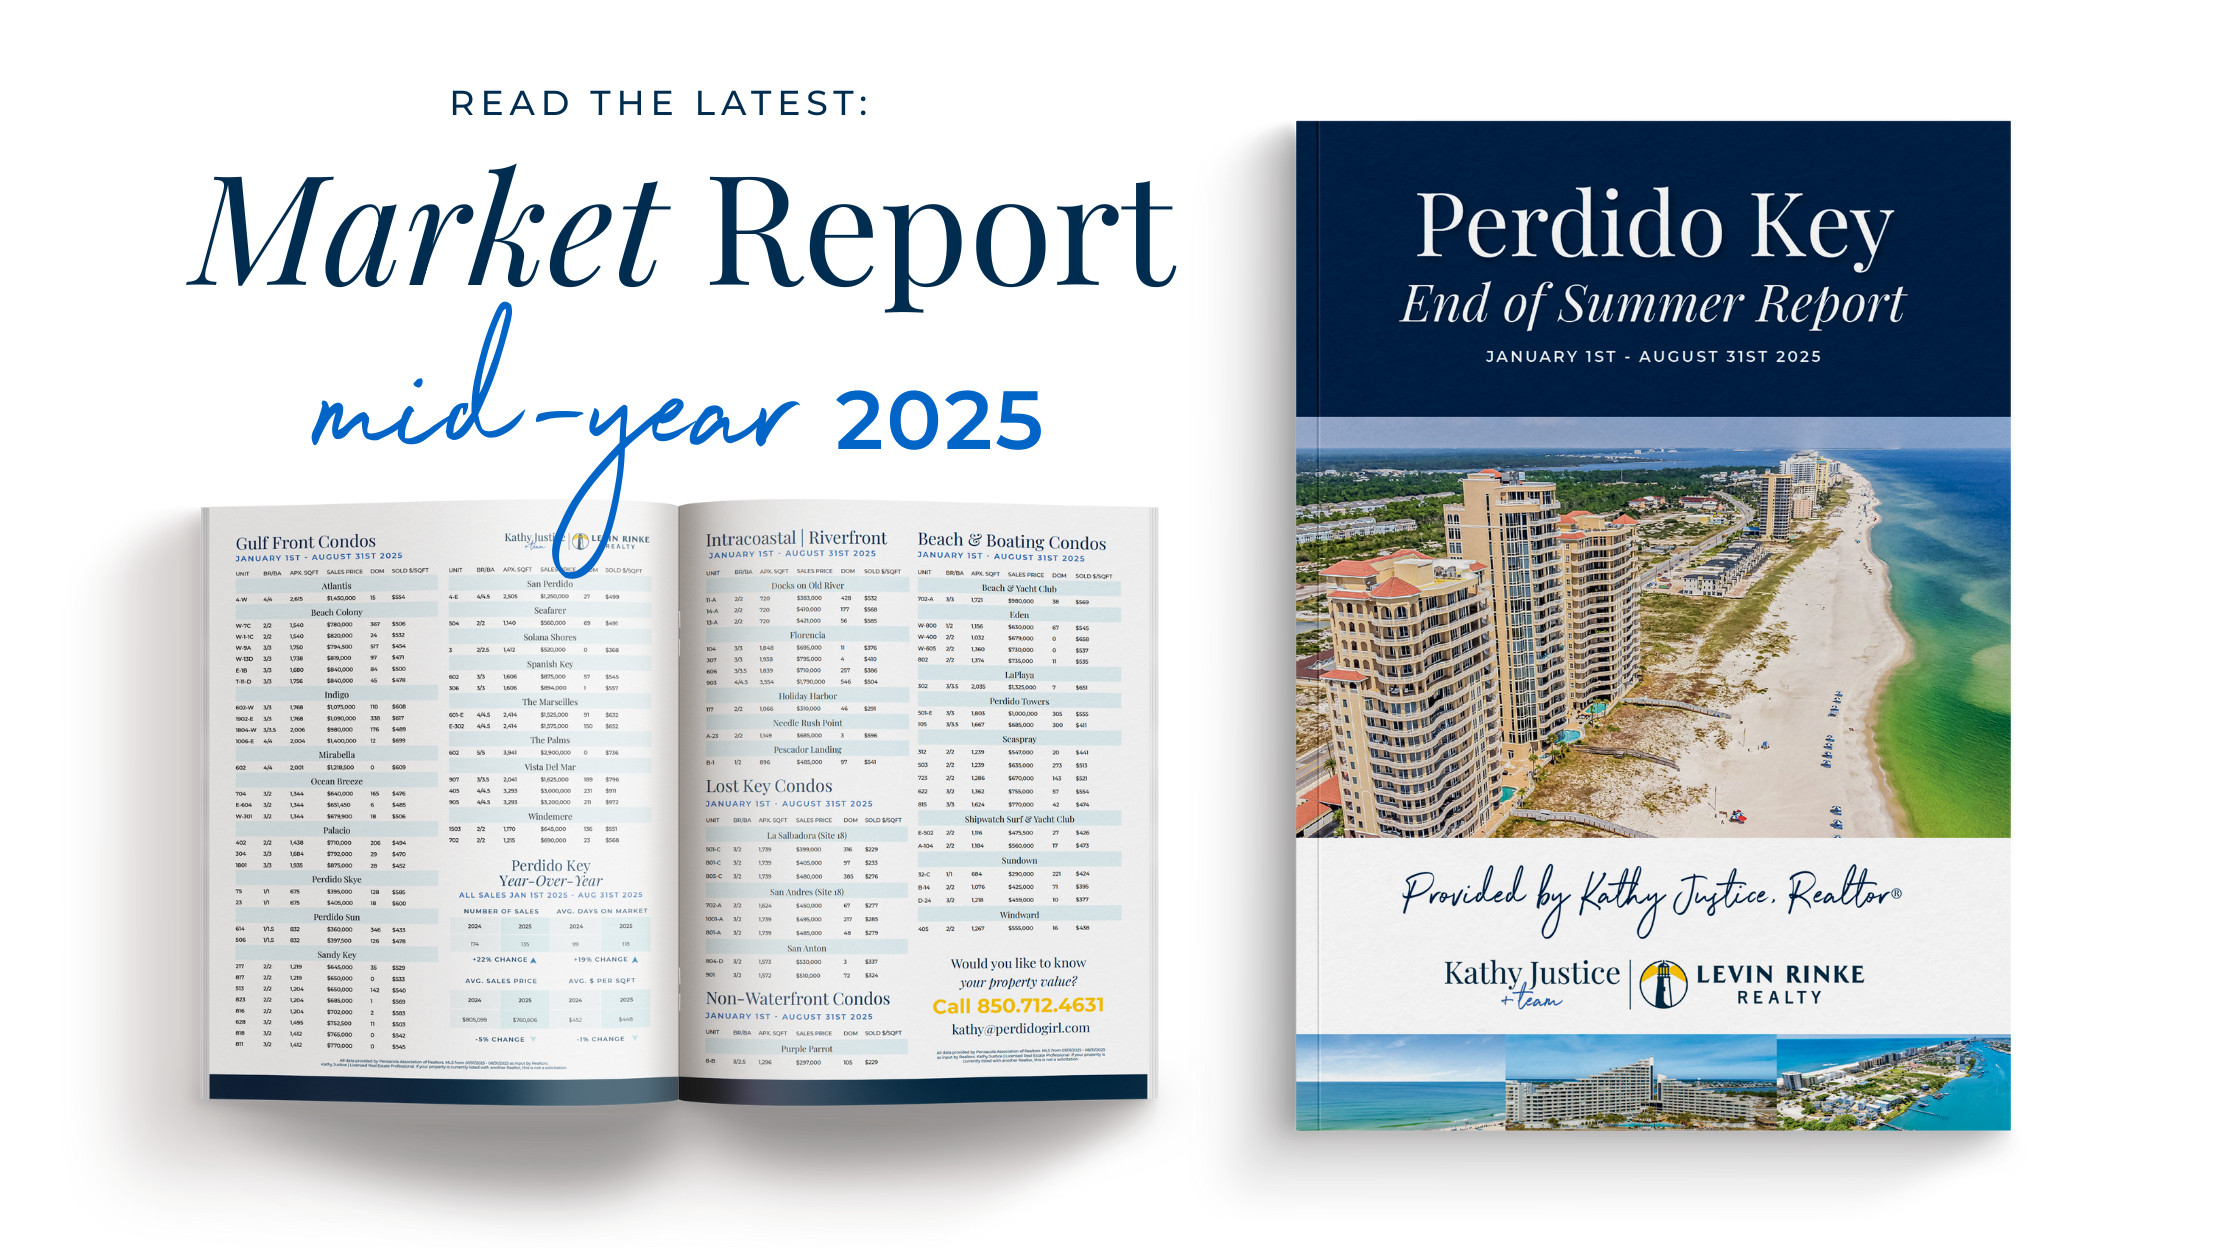
Perdido Key, FL. – Perdido Key’s housing market remained active through the first eight months of 2025, presenting opportunities for buyers while still offering value for sellers, according to data from the Pensacola Association of REALTORS® Multiple Listing Service (MLS). Compared to the same period in 2024, overall sales were down 22%, with properties spending more time on the market and average sales prices softening slightly. Notably, August marked the first month in 2025 to edge out 2024 numbers with a slight uptick in sales, and as of early September, activity has continued to show signs of improvement across much of the market.

Condominium Market
In the condominium market, which represents the majority of Perdido Key’s sales activity, results were mixed. Gulf front condos experienced softer numbers compared to 2024, while certain segments such as Intracoastal Riverfront properties recorded notable price gains. Sellers in all sought-after communities continue to see strong sales prices.
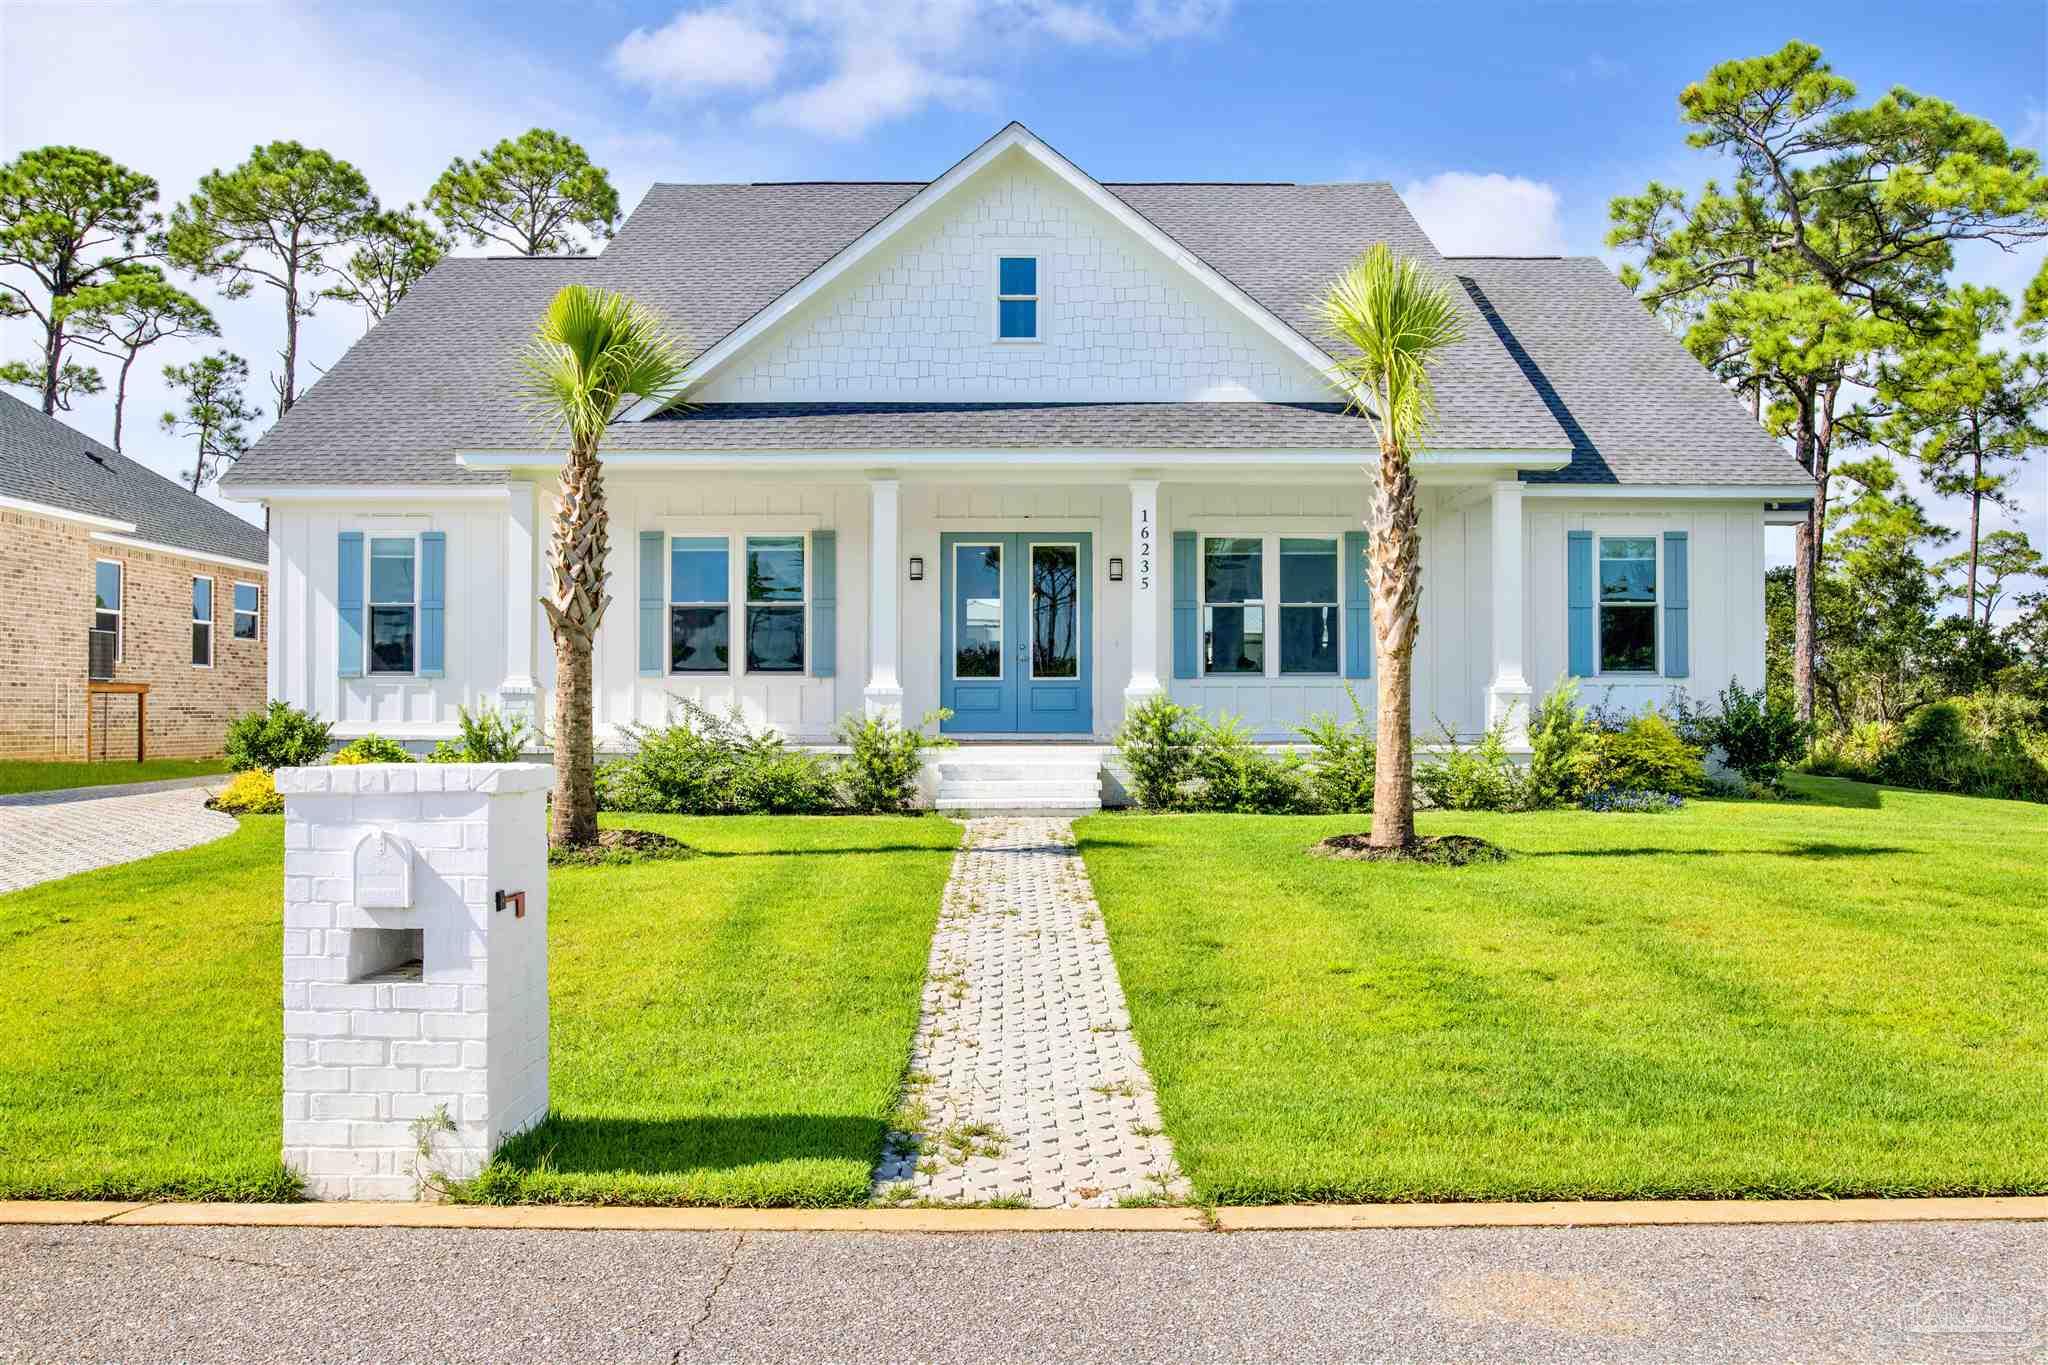
Single-Family Homes
The single-family home market showed slower sales volume and longer days on market, offering buyers more time to evaluate options. Still, sellers in desirable neighborhoods continue to see steady interest and competitive offers.
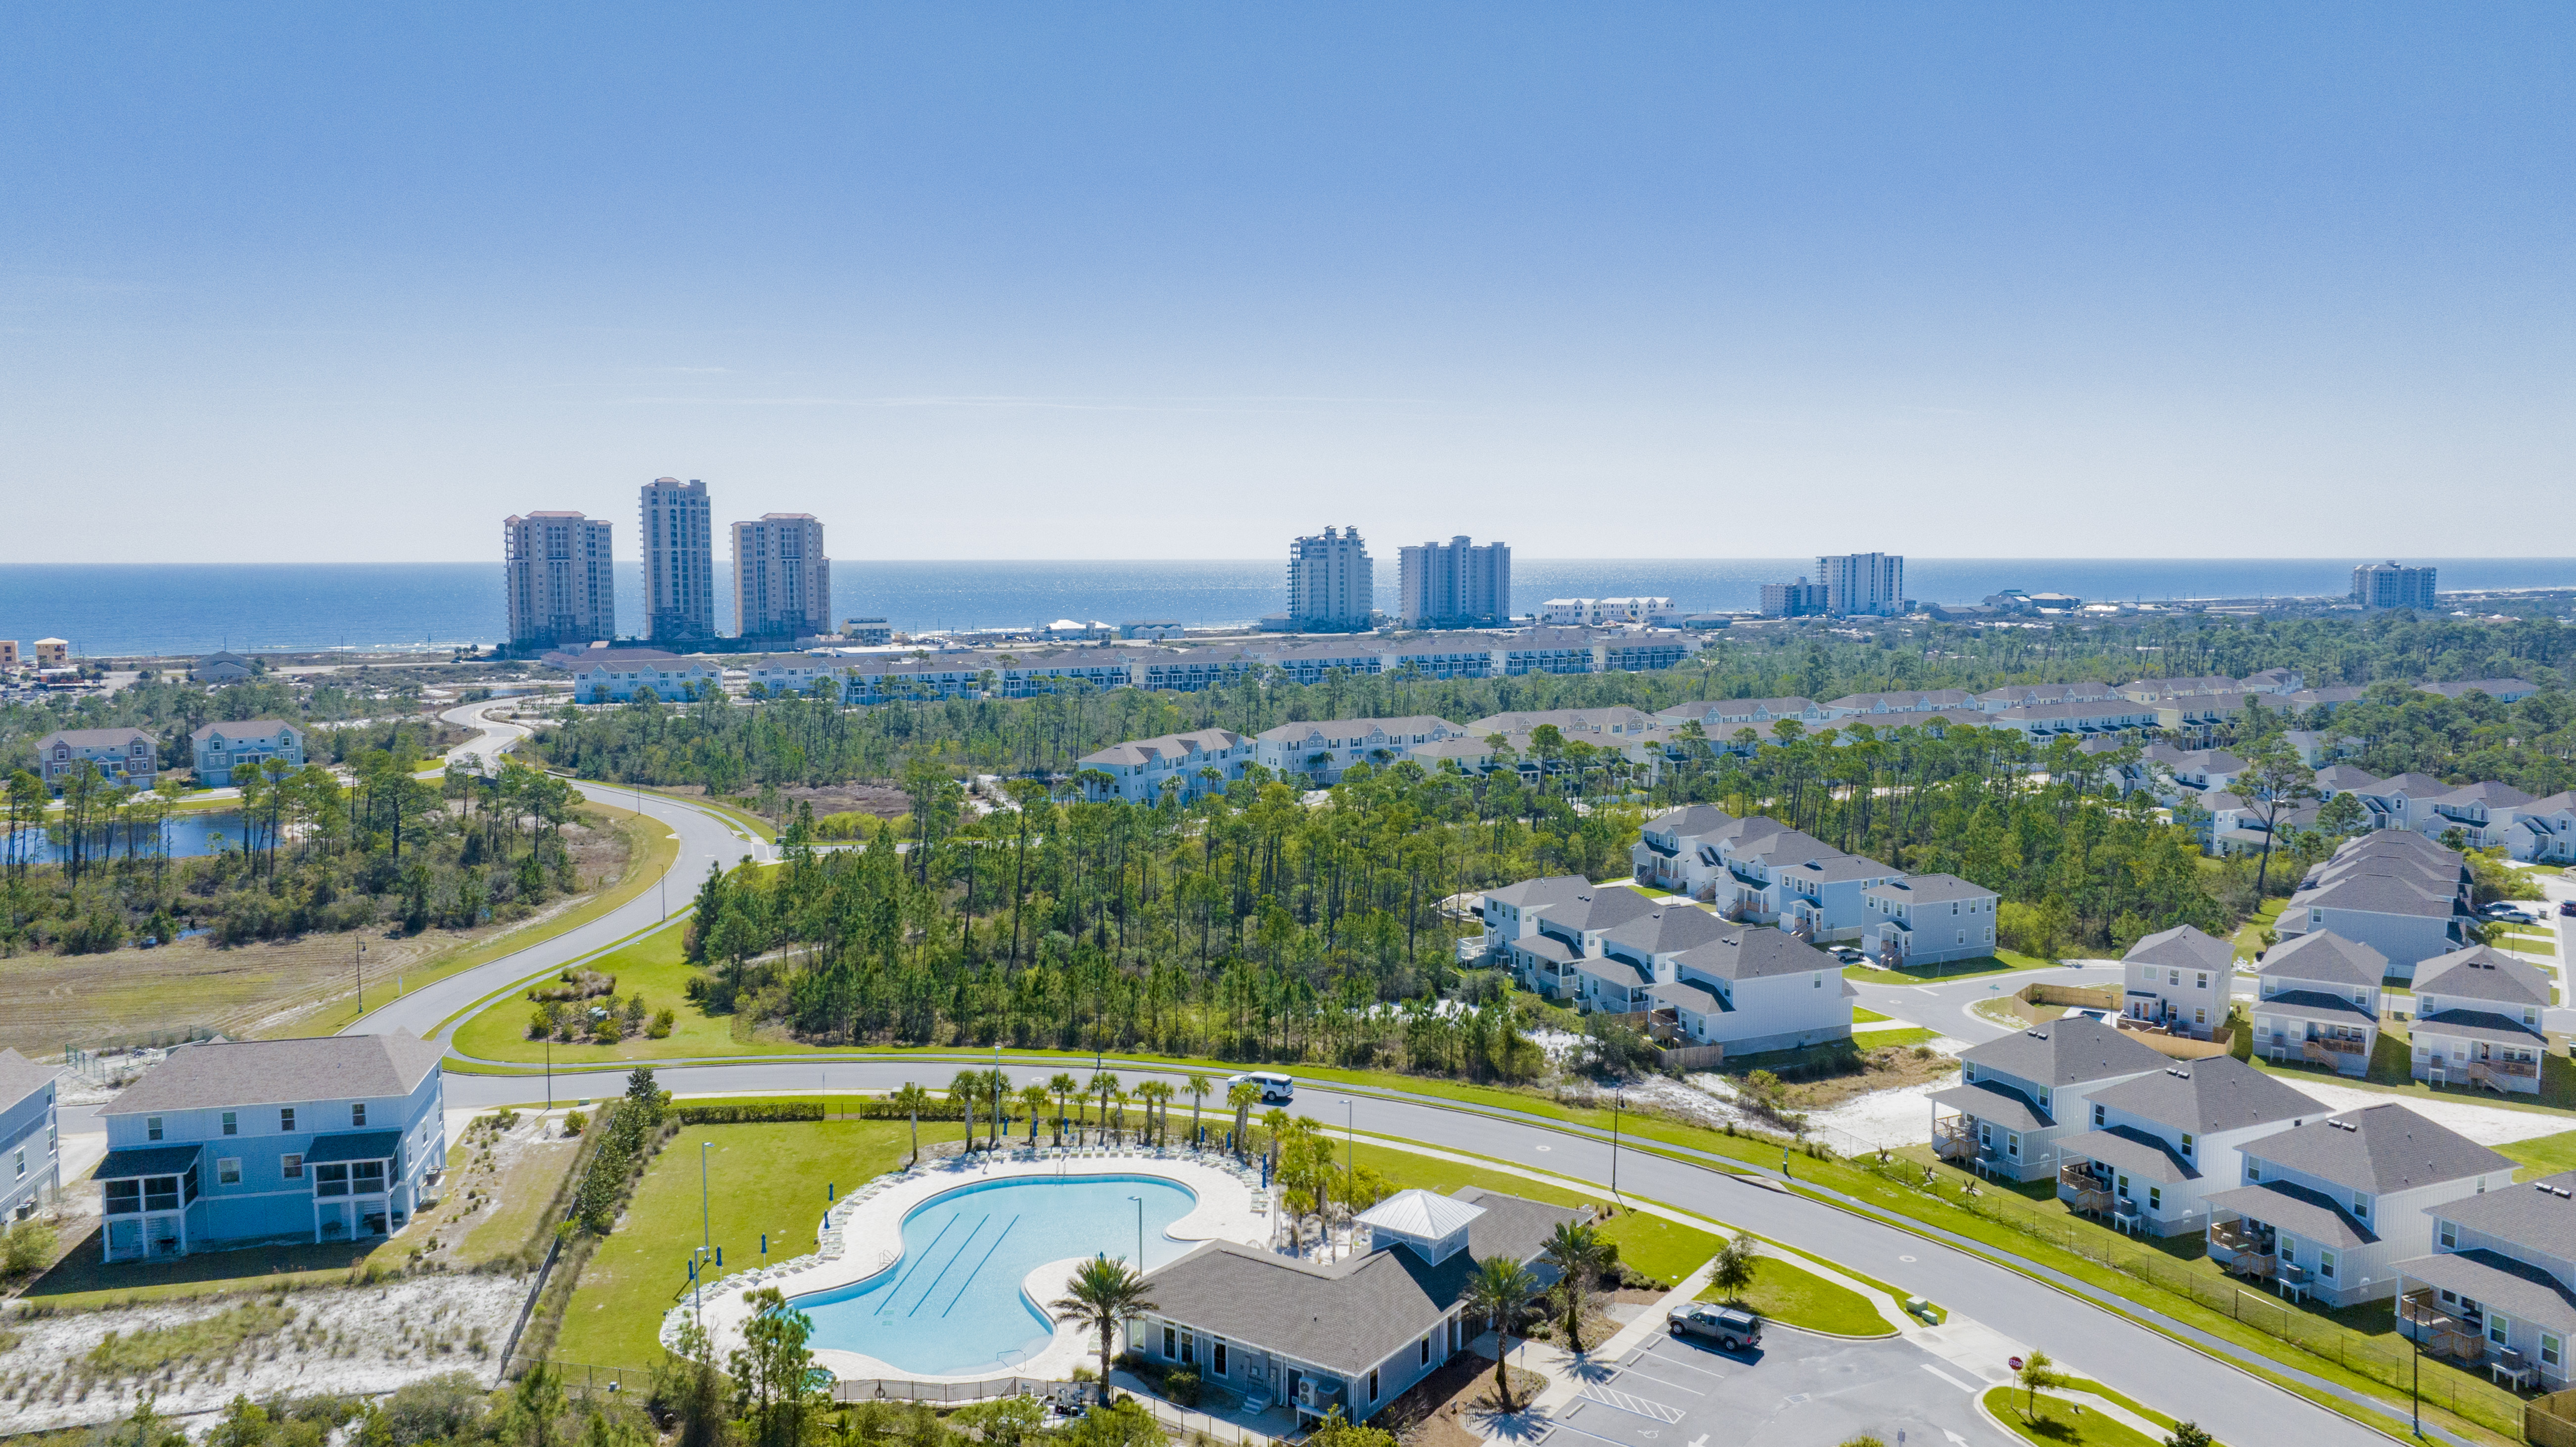
Townhome Market
The townhome market, which is mostly concentrated in Lost Key, showed the longest days on market and the most significant price decline at 15%, primarily driven by excess supply. This shift has created notable opportunities for buyers.
Outlook
These end-of-summer indicators point to a more balanced market - one where buyers can find opportunities, while sellers who price and market their homes effectively can still achieve strong results. Looking ahead, the outlook for fall activity remains positive in our coastal real estate market!
Residential MLS Stats: Perdido Key
All Condos:
(Jan 1 – Aug 31, 2025)
- Properties sold: 93
↓ 24% from Jan–Aug 2024 - Average Days on Market: 110
↑ 9% from Jan–Aug 2024 - Average Sales Price: $754,786
↑ 3% from Jan–Aug 2024 - Average Price Per Square Foot: $488
↑ 3% from Jan–Aug 2024
Gulf Front Condos:
(Jan 1 – Aug 31, 2025)
-
Properties sold: 62
↓ 15% from Jan–Aug 2024 - Average Sales Price: $899,949
↓ 3% from Jan–Aug 2024 - Average Days on Market: 94
↑ 3% from Jan–Aug 2024 - Average Price Per Square Feet: $542
↓ 1% from Jan–Aug 2024
Intracoastal | Riverfront Condos:
(Jan 1 – Aug 31, 2025)
- ·Properties sold: 10
↓ 60% from Jan–Aug 2024 - Average Days on Market: 163
↑ 57% from Jan–Aug 2024 - Average Sales Price: $668,400
↑ 30% from Jan–Aug 2024 - Average Price Per Square Foot: $479
↑ 32% from Jan–Aug 2024
Single Family Homes:
(Jan 1 – Aug 31, 2025)
- Properties sold: 19
↓ 14% from Jan–Aug 2024 - Average Days on Market: 158
↑ 35% from Jan–Aug 2024 - Average Sales Price: $1,004,138
↓ 26% from Jan–Aug 2024 - Average Price Per Square Foot: $382
↓ 14% from Jan–Aug 2024
Townhomes: *Includes Lost Key townhome sales by volume.*
(Jan 1 – Aug 31, 2025)
- Properties sold: 23
↓ 21% from Jan–Aug 2024 - Average Days on Market: 120
↑ 62% from Jan–Aug 2024 - Average Sales Price: $582,960
↓ 15% from Jan–Aug 2024 - Average Price Per Square Foot: $340
↓ 5% from Jan–Aug 2024
Lost Key Golf & Beach Club: *Includes townhomes, condos, & single family sales by volume.*
(Jan 1 – Aug 31, 2025)
- Properties sold: 32
↓ 16% from Jan–Aug 2024 - Average Days on Market: 143
↑ 51% from Jan–Aug 2024 - Average Sales Price: $553,315
↓ 5% from Jan–Aug 2024 - Average Price Per Square Foot: $313
↓ 2% from Jan–Aug 2024
Perdido Key Year-Over-Year:
(Jan 1 – Aug 31, 2025)
- Properties sold: 135
↓ 22% from Jan–Aug 2024 - Average Days on Market: 118
↑ 19% from Jan–Aug 2024 - Average Sales Price: $760,606
↓ 6% from Jan–Aug 2024 - Average Price Per Square Foot: $448
↓ 1% from Jan–Aug 2024
Posted by Kathy Justice on
Leave A Comment